Assessing Global and Regional Iron Content in Deep Gray Matter as a Function of Age Using Susceptibility Mapping
By: Karen Holzberger, President & CEO of SpinTech MRI
Author(s): Manju Liu, PhD,1 Saifeng Liu, PhD,2 Kiarash Ghassaban, BS,1 Weili Zheng, PhD,3 Dane Dicicco, BS,4 Yanwei Miao, MD,5 Charbel Habib, PhD,3 Tarek Jazmati, MD,4 and E. Mark Haacke, PhD1,2,3,4*
Journal: Journal of Magnetic Resonance Imaging
Published: 2016
Read Full Paper: https://onlinelibrary.wiley.com/doi/abs/10.1002/jmri.25130
Abstract

The purpose of this study was to investigate the correlation of non‐heme iron content in deep gray matter nuclei as a function of age using quantitative susceptibility mapping (QSM) from both whole‐structural and regional perspectives.
Method
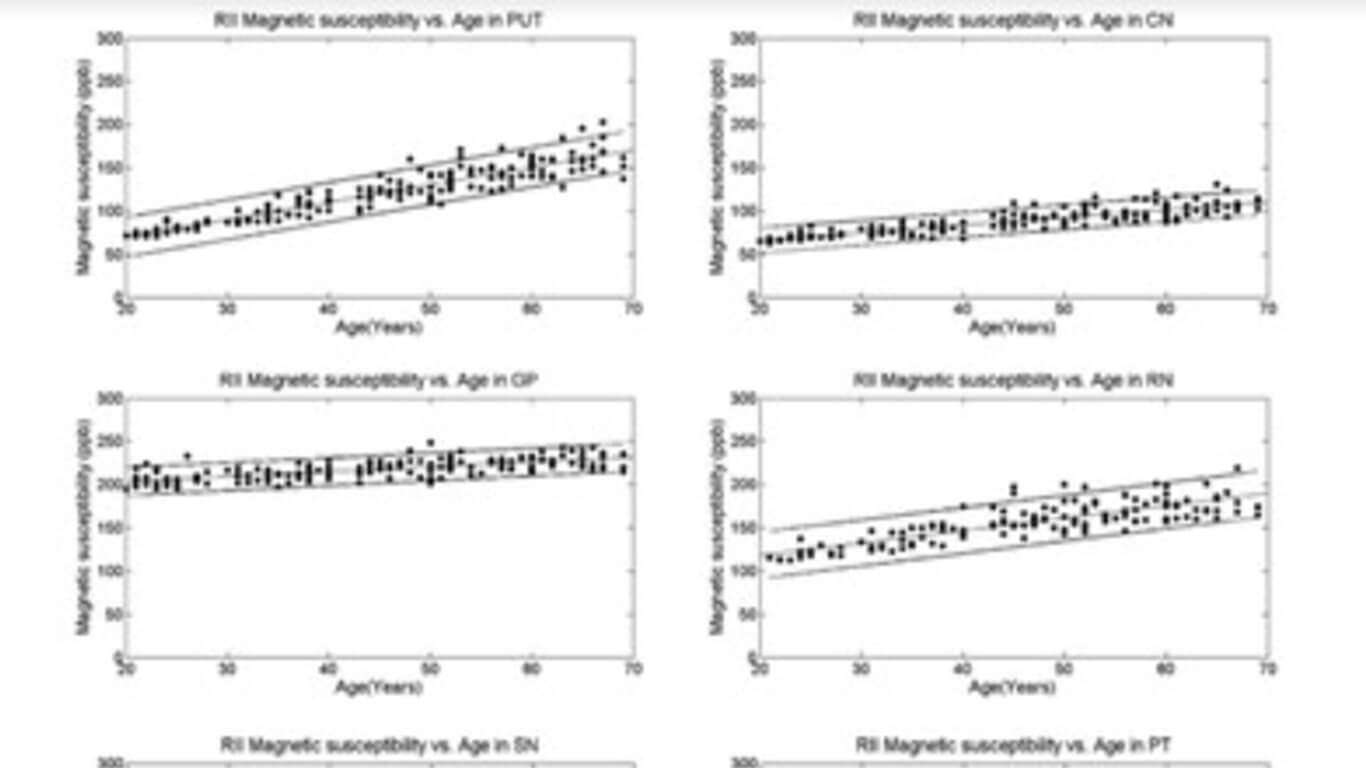
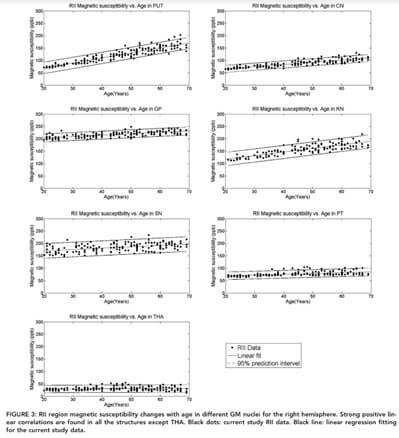
We studied a group of 174 normal subjects ranging from 20 to 69 years old and measured the magnetic susceptibility of seven subcortical gray matter nuclei. SWI (susceptibility‐weighted imaging) phase images were used to generate the susceptibility maps, which were acquired on a 1.5T scanner. The 3D whole‐structural measurements were used to determine age‐related thresholds, which were applied to calculate the local iron deposition (RII: portion of the structure that contains iron concentration larger than the structure threshold). Age‐susceptibility correlation was reported for each measured structure for both the whole‐region and two‐region (low iron and high iron content regions) analysis.
Results
For the local high iron content region, a strong age‐susceptibility correlation was found in the caudate nucleus (CN,R = 0.9), putamen (PUT,R = 0.9), red nucleus (RN,R = 0.8), globus pallidus (GP,R = 0.7), substantia nigra (SN,R = 0.5), and pulvinar thalamus (PT,R = 0.5); for the global iron content, a strong age‐susceptibility correlation was found in CN(R = 0.6), PUT(R = 0.7), and RN(R = 0.6). Overall, for each structure analyzed in this study, regional analysis showed higher correlation coefficient and higher slope comparing to the whole‐region analysis. Further, we found the quantitative conversion factor between magnetic susceptibility and iron concentration to be 1.03 ± 0.03 ppb per μg iron/g wet tissue.
Conclusions
We conclude that the age‐susceptibility correlation can serve as a quantitative magnetic susceptibility baseline as a function of age for monitoring abnormal global and regional iron deposition. A regional analysis has shown a tighter age related behavior, providing a reliable and sensitive reference for what can be considered normal iron content for studies of neurodegenerative diseases.

